

Newsletter #2 /2022
issued in February 2022
The COGNINTEL application experiment supported by DIH4CPS Network is presenting its second issue of the news on progress being made in the second half of 2021 until begin of 2022.
Meet the COGNINTEL
ERREDUE, SCORTA Srl, and the DIH CIIRC CTU are progressing on the application experiment “COGNINTEL”, running within the DIH4CPS project (financed by the EC under the H2020 framework).
COGNINTEL application experiment aims to deploy AI-based decision making and control platform tailored to the machine tools industry to optimize their operations by enabling an holistic and intelligent Quality, Energy and Maintenance (QEM) management approach.
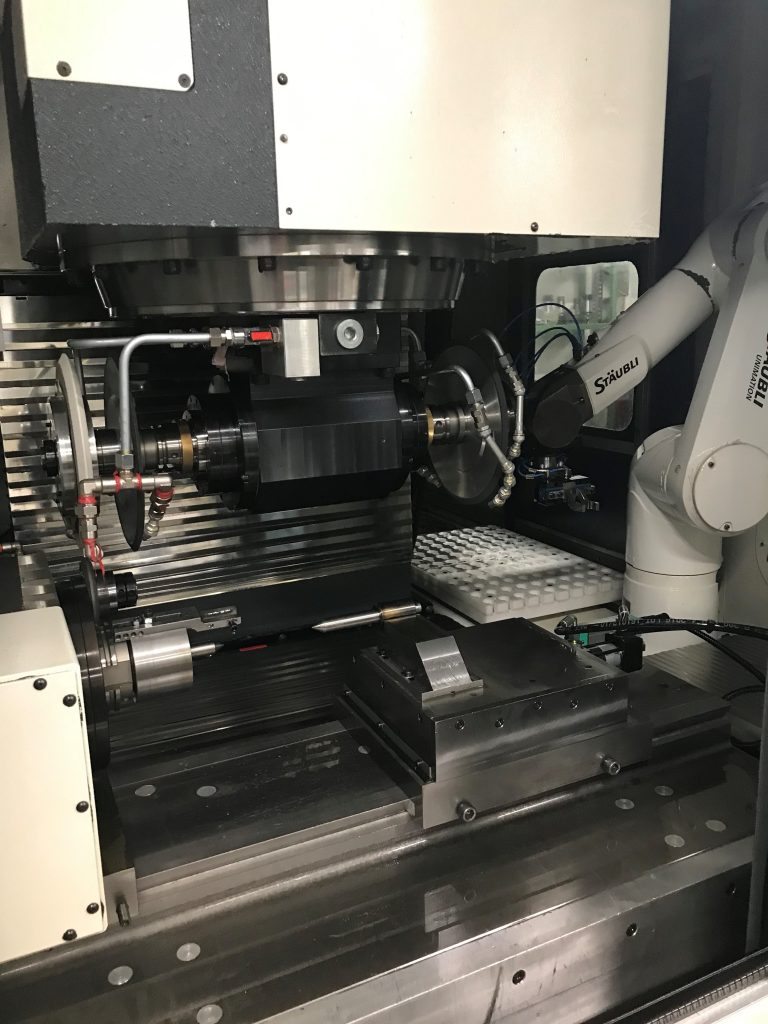
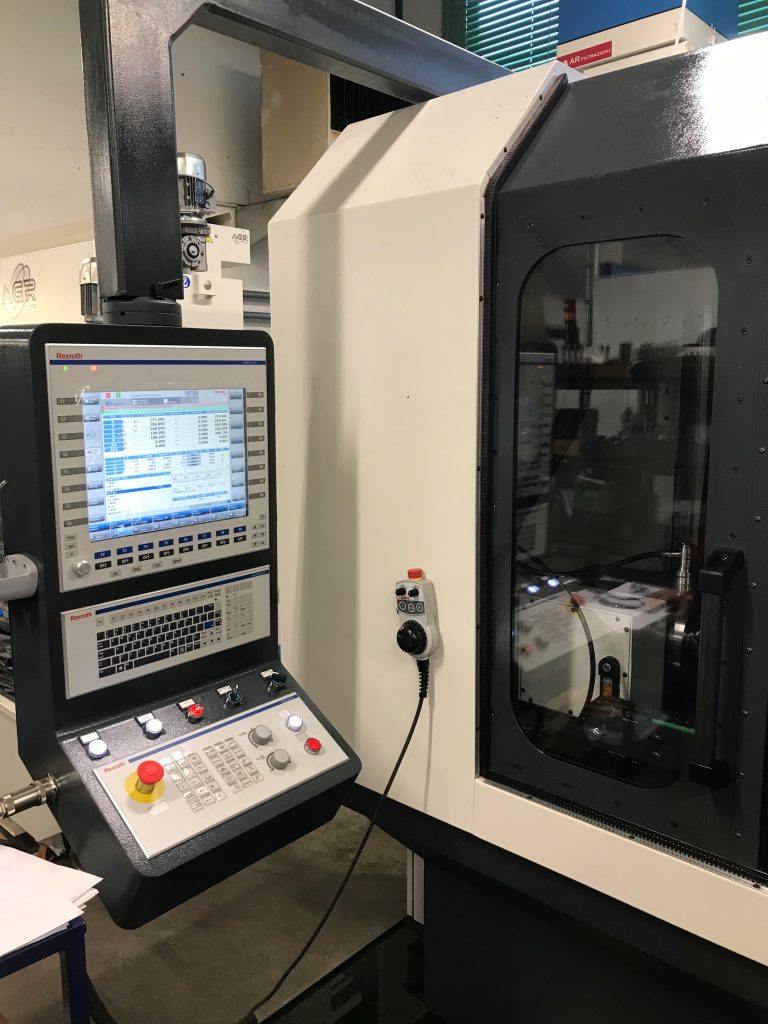
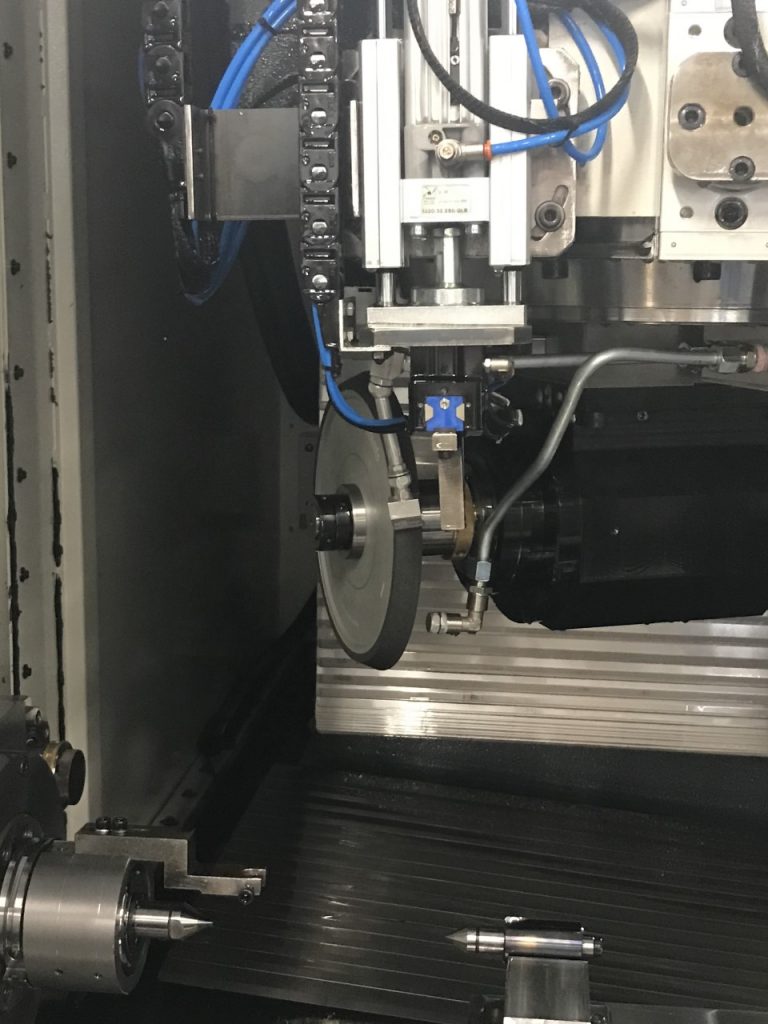
Pilot in SCORTA
Sensors and IoT devices have been installed on Pilots. Process data related to CNC/PLC and vibration signals (timeseries) are then collected and stored in a central SQL DB.
Dataset consists of more than 50 signal/features (e.g. currents, speeds, temperatures, powers, RMS values of vibration within specific frequency bins of FFT and H-FFT), recorded approx. every 250 ms.
All pre-processing tests confirmed the correct acquisition and storing of data/signals and then validated the implemented sensors/IoT architecture. This is a crucial milestone that have been reached and it is of paramount importance to boost the developments of AI algorithms for anomalies predictions that will be carried out in the next months of the experiment.
Pre-processing Data Analysis
Raw data are then parsed by specific pre-processing data analytics workflows (developed with KNIME analytics platform ® ) to obtain a structured and tailored-to-the purpose dataset to be used for AI-based models training.
Such pre-processing includes:
Data cleaning: this block concerns the removing of duplicated records, missing values, and outliers.
Data aligning: since each signals is recorded and stored with some lag in time (due to inherent latency of the sensors network) a time alignment strategies is needed.
Data aggregation: this block concerns the definition of a specified granularity of the temporal series of signals. In this experiment a granularity of 1 min has been selected; therefore, the raw data are aggregated (e.g. taking the ‘mean’ value of the concerned signal) within each time interval (dT) of 1 min. Other granulation strategies can be of curse set
Dimensionality reduction: this block concerns the transformation of data from a high-dimensional space into a low-dimensional space so that the low-dimensional representation retains some meaningful properties of the original data, ideally close to its intrinsic dimension.
Data labelling: this block concerns the automatic assignment of specific labels, with respect to anomalies events (such as Failure and/or any other quality-related issues), to the dataset.
SMOTE: The resulting dataset for the business scenario addressed by this experiment is expected to be strictly imbalanced. SMOTE (Synthetic Minority Oversampling Technique) is a type of data augmentation for the minority class (in this case “anomaly events” of the process).
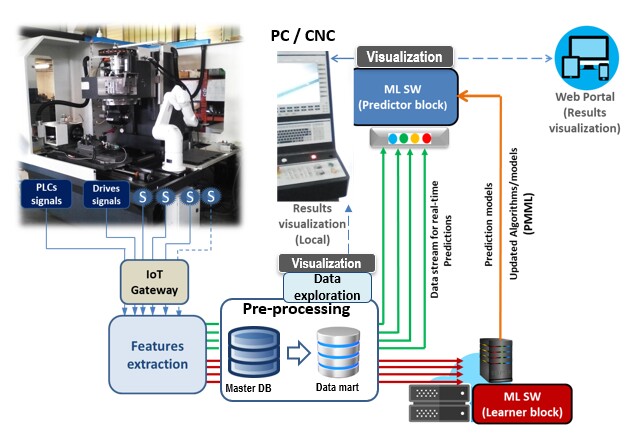
The Reference Implementation Framework of Pilots
To prove the correct acquisition and storing of data/signals and then preliminary validate the overall sensors/IoT architecture some tests have been carried out. Click on the figure for the implemenation scheme of the experiment.
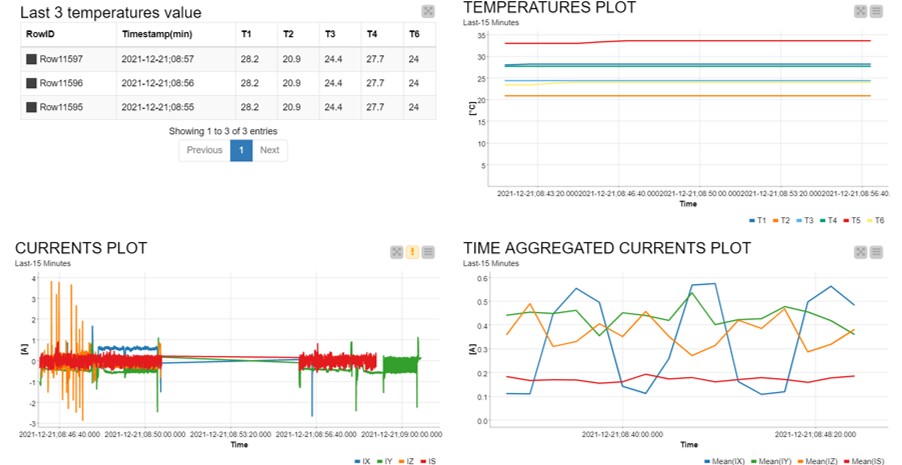
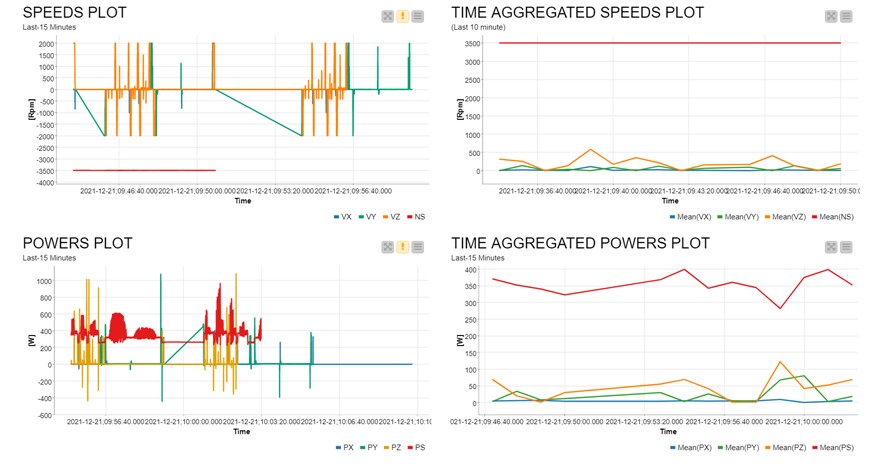
Data Visualization
Data visualization and exploration have been included in the pre-processing workflow to enable a preliminary analysis of quality of imported data.
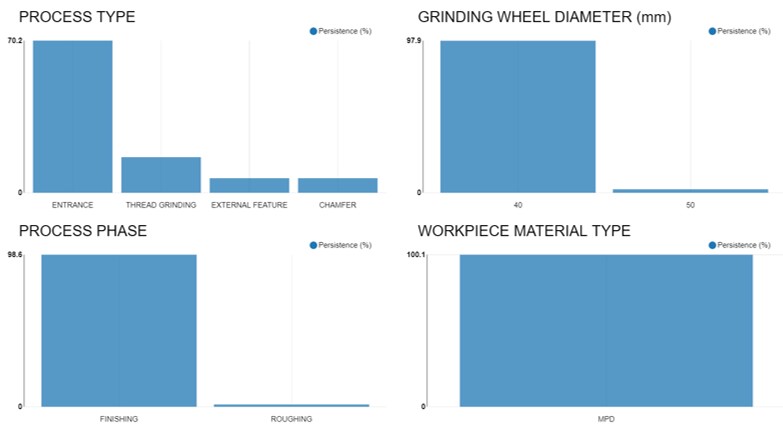
A text mining workflow has been also included to classify process conditions and visualize statistics about the process itself.
Gallery of CNC features visualization and process data statistics of Pilot:
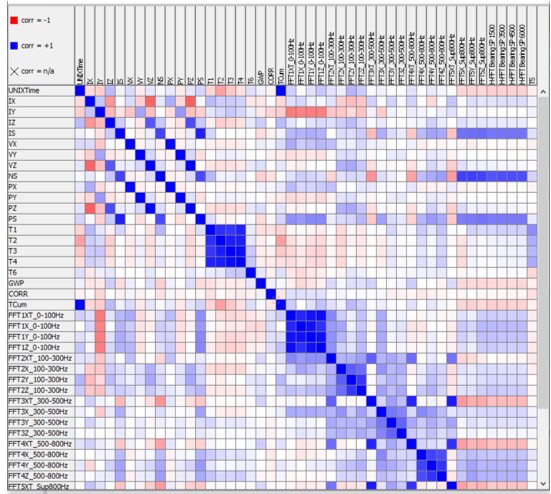
Cross-Correlation Matrix
Finally, the visualization and data exploration tool include the correlation matrix view to enable comprehension about overall behaviour of selected features.
Column (features) with high linear correlation to each other will ask for a more detailed investigations by data scientists/engineers to understand whether such correlation is caused by data acquisition problems or by real physical links between variables (in the latter cases the removing of one the feature could be an option for dimensionality reduction)